ROC curve demonstration
There are lots of applications to machine learning, and the most popular problem in practice is binary classification. Examples of things we want to predict:
- user will click / buy something or not
- page is appropriate to request or not
- charge of particle is positive or negative
- observed signal decay or something else
- bright object on the sky is galaxy or quasar
There are many different area-specific metrics to estimate quality of classification, however the basic tool one should be able to work with regardless of the area is ROC curve (which I will talk about in this post).
Notions in binary classification for binary predictions, is/as notation
We have two classes: class 0 and class 1, background and signal respectively. In the simplest case predictions are binary: each observation is attributed by a classifier to be signal or background.
Unfortunately, there are too many terms used in the literature to describe this (trivial) classification result. Scary image from wikipedia shows how many different terms people were able to invent to describe a space with 4 degrees of freedom.
Let me introduce my own notion, hopefully more systematic (%picture about 15 standards%):
- isS (isSignal), isB (isBackground) — how many observation really belong to this class
- asS (asSignal), asB (asBackground) — how many observation were classified as signal (background)
- isSasB (isSignalasBackground) — how many signal observation were erroneously classified as background. isSasS, isBasB, isBasS are defined in the same way.
Hardly one can misunderstand what each of introduced numbers means.
So, there are actually only 4 basic numbers: isSasS, isSasB, isBasS, isBasB.
All the other information can be easily reconstructed:
- isS = isSasS + isSasB
- isB = isBasS + isBasB
- asS = isSasS + isBasS
- asB = isSasB + isBasB
Other typically used measures:
-
true positive rate (part of correctly classified signal, also known as recall, sensitivity or signal efficiency).
tpr = isSasS / isS -
false positive rate (part of incorrectly classified background, aka background efficiency)
fpr = isBasS / isB -
also there are
tnr = isBasB / isBandfnr = isSasB / isS(tnr also known as specificity)
Other way to define parameters is True/False Positives/Negatives:
TP = isSasS, FP = isBasS, TN = isBasB, FN = isSasB
But it is too easy (at least for me) to mess FP and FN, so I prefer to avoid this notion.
Continuous predictions. ROC curve
As it is clear now, there are different ways to measure quality of binary predictions. The bad thing is people frequently start by comparing those.
Meanwhile, the output of classifier is real-valued, not binary.
What’s wrong with using binary predictions?
- to estimate quality, one needs to select threshold. Usually people forget about this (and use default, which far from the optimal one)
- binary metrics are frequently unstable and need many samples in validation (statistical variation is comparable to gain obtained by changing parameters), this drives to unstable model selection.
- in many cases, trained classifier is not used to make decisions, but needed reconstruct the probabilities later used in next stages of ML pipeline
It's a bad idea to use rough predictions of classifier (classifier.predict(X)in scikit-learn), instead always use probabilitiesclassifier.predict_proba(X)
So the right way is to look at the whole picture and compare how well the classifier was able to separate classes. How ‘far’ distributions of output of signal and background.
ROC curve
The graphical way to compare output of two classifiers is ROC curve,
which is built by checking all possible thresholds.
For each threshold tpr and fpr are computed (which part of signal/background event passes this threshold).
After checking all possible thresholds, we get the ROC curve. When ROC curve coincides with diagonal — this is the worst situation, because two distributions coincide. The higher ROC curve — the better discrimination between signal and background.
If at every point ROC curve of classifier A is higher than curve of classifier B, we are sure to say that in any application classifier A is better.
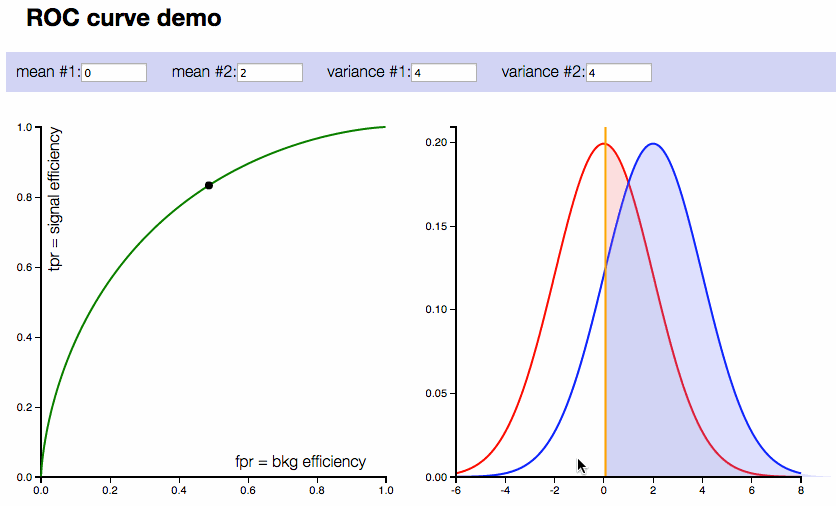
ROC curve interactive demo
You can play with this demonstration, it’s expected to work in any browser without additional plugins.
Instructions
On the right plot: two compared distributions (normal distributions are considered in this demonstration). On the left plot: corresponding ROC curve.
Controls:
- 4 inputs with means and variances of distributions
- Also vertical line corresponding to threshold can be moved
Presentation was prepared by Oleg Alenkin and Alex Rogozhnikov.
Area under ROC
General-purpose measure of classification quality is area under ROC curve.
In the worst case it is 0.5, while the ideal classification corresponds to area = 1.
This figure of merit is very stable (prediction for a single data sample does not change the value significantly), and moreover enjoys the following mathematical property:
\(\text{area under ROC} = P(x < y)\), where $x$ and $y$ are predictions of random signal and background samples. So this is a probability that random signal and random background samples’ predictions are correctly ordered.
Measures of quality through the prism of ROC
Interesting moment in ROC curve is that it is completely invariant to any monotonic transformations of classifier’s output. If you divide the predictions of classifier by two, ROC curve will stay the same. Or if you exponentiate predictions — again, nothing changes.
This notable property makes ROC curve the universal base for comparison of classification models, because it contains all necessary information (fractions of observations passing thresholds) while ignoring everything inessential (predictions values).
However curve is not a number, and the final quality still should be computed according to real problem (based on ROC curve).
accuracy: assuming that you have $N_s$ signal objects and $N_b$ background objects, the expected number of quest samples is $N_s \times TPR + N_b \times (1 - FPR)$, to maximize the number of correctly predicted objects, you should select a threshold, which corresponds to maximum of this value on the ROC. (As you can check, at this point ROC should be tangent to line $N_s \times TPR - N_b \times FPR = const$.
weighted accuracy: another example (which frequently corresponds to practice). Imaging that for each correct guess about new object you are paid. But the cost for correctly guessing signal and background are different: $c_s, c_b$. To maximize the income, the threshold for decision rule should correspond to point at ROC curve, where \(N_s \times TPR \times c_s + N_b \times (1 - FPR) \times c_b\) is maximal.
One of such examples is email spam filtering: cost for incorrect classification of ham letter is times higher than cost for making wrong prediction for spam letter.
In particle physics more complicated expressions are usually taken as a final measure of classification quality. Those are corresponding to hypothesis testing (punzy metric, median significance), but the idea is still the same: one should maximize some figure of merit and take corresponding threshold.
 Gradient boosting
  Hamiltonian MC
  Gradient boosting
  Reconstructing pictures
  Neural Networks