Optical pooled screens of cells (overview of emerging biotechnology)
This month brought two preprints describing optical pooled CRISPR screens. What’s this new technology, what it can be used for, and why I’ve been waiting for it? I’ll make a small comparison of approaches and critically review the papers.
Best of all — I am not affiliated with either team, and this is likely the most unbiased review you’ll find 😅
Papers discussed:
- PERISCOPE
aka Perturbation Effect Readout In situ with Single Cell Optical Phenotyping from A genome-wide atlas of human cell morphology (Broad Institute) - CP-POSH
aka Cell Painting Pooled Optical Screening in Human cells from A Pooled Cell Painting CRISPR Screening Platform Enables de novo Inference of Gene Function by Self-supervised Deep Learning (Insitro Inc.)
In the next parts I discuss some details from these preprints.
Preface
To drive experiments in biological systems you need two components:
-
intervention: change something in cell (or organoid, or organism).
For a broad understanding of biological system you want to have detailed control of all of its parts. CRISPR solves this by individually acting on any selected gene. This makes CRISPR-driven experiment more interpretable and ensures high coverage of biological processes.
-
readout: detect change in some characteristic. Better characterization of system would involve high-dimensional description. E.g. just measuring cell size, cell death and pH provides little insight into what’s happening.
Several sequencing-based assays provide rich description, and many of them provide single-cell readouts. Cell painting stands out: it is much cheaper, microscopy-based, and still captures a lot of biologically-relevant information.
Effectiveness of the system for unbiased discovery, roughly, is a product of these two dimensions: how well you control the biology and how well you can describe results of intervention.
Pooled CRISPR screens with scRNAseq/scATAC stand out in both dimensions.
They combine 1. complete control via CRISPR with 2. very high-dimensional interpretable readout.
Sounds awesome (and it is!), but we need to introduce one more factor to the equation:
-
price per experiment. The more observations you have the merrier. We already found there are a ton of things happening in our biology, and to find at least a majority of them in an unbiased manner, a number of attempts is required.
Pooled screens are very efficient in experiment material: every cell is turned into a tiny individual experiment. Still, with all multiplexing/overloading tricks, a cost-per-cell in scRNAseq is comparable to cost-per-well in cell painting. Quite a difference!
Optical pooled CRISPR screening, a focus of this post, replaces expensive sequencing with cheap microscopy, and drops price-per-cell >200 fold (PERISCOPE reports price-per-cell ~$0.001). Compared to arrayed optical screens, lower requirements for automation can be expected as all conditions share the well.
Overall, technology opens an opportunity for massive experimentation.
Why do we need an even more scalable assay? 🤔
Great question! A number of whole-genome pooled screens have been conducted, arrayed whole-genome screens were run with cell painting. Recursion, who pioneered adoption of Cell Painting, scaled it to 2 million wells a week. Why would you wish for even more?
Gene perturbation can be more nuanced than just knockout. CRISPR tiling, an approach to scan for important positions in genome, requires a lot of experiments.
Space of interventions also goes beyond single-gene at a time. If e.g. two proteins can perform similar function (“alternative pathways”), downregulating just one of them won’t have as much effect (periscope paper accidentally needs double KO of M6PR and IGF2R). These cases, when the effect in combination is different from combination of effects, are of high interest and give a more direct hint at underlying biology than just similarity of images. At the same time such cases are (likely) sparse, and should be found across 20k x 20k = 400m combinations…
Sometimes you need to interact with more than two genes at a time, for instance to create iPSCs. Recall that iPSC creation relies on simultaneous expression of 4 Yamanaka factors. For reference, the original Yamanaka paper screened 24 candidate genes. To improve upon this “recipe”, a large number of combinations should be tried. Scanning just combinations of 4 factors out of 100 TFs already takes around 4 million attempts.
Combinatorial space stays almost unexplored. Dropping price even more still won’t make it possible to check all possible combinations, and this exploration should be driven by ML. ML-friendliness thus becomes a requirement.
There are non-genetic perturbations that are of high interest: cell environment, additions of chemicals or biologics. Unfortunately, usually there is no way to ‘massively multiplex’ these conditions, and microwell stays the minimal possible unit of experiment. Notable exception are peptides, as those similarly can be barcoded and participate in a pooled screen. Peptides can be used both as discovery tool (e.g. to block some interaction or activate receptor) and as a therapeutic.
Challenges needed to be solved
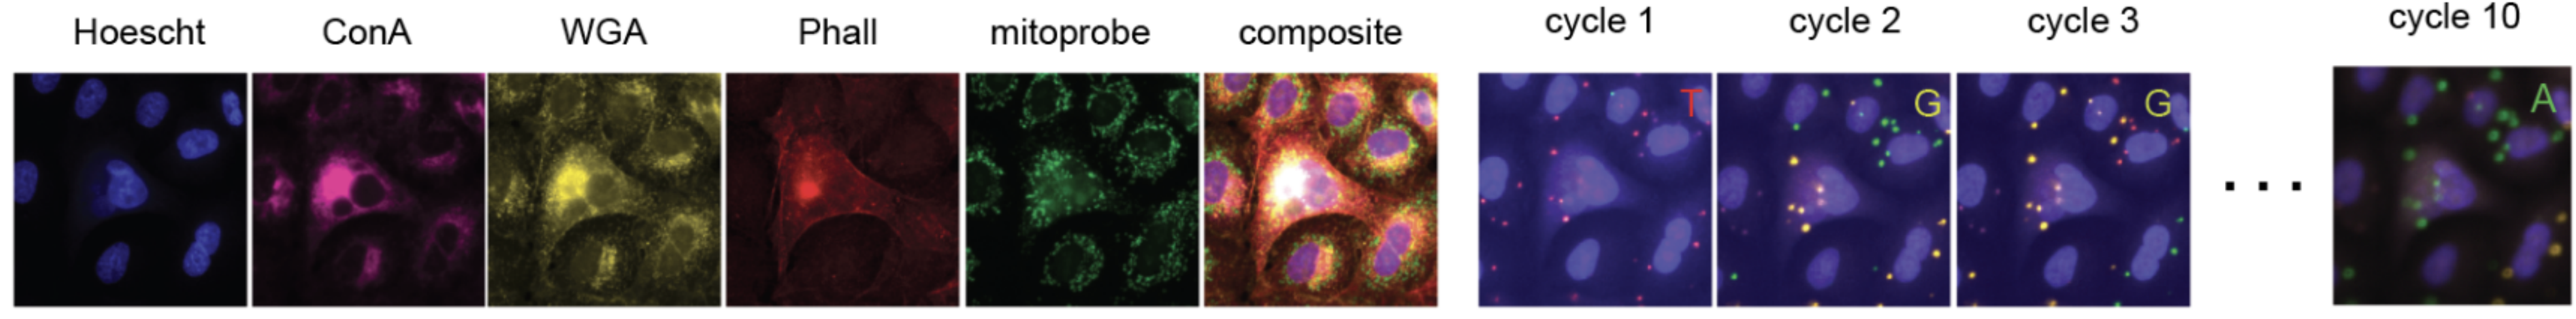 Cell Painting (left, 5 channels + composite)
and base calling in ISS (right) have significant overlap in channels.
Cell Painting (left, 5 channels + composite)
and base calling in ISS (right) have significant overlap in channels.
Image from CP-POSH preprint.
Interventions are encoded with sgRNA barcodes. In situ sequencing (ISS) is used to read the barcode back.
-
Main issue is merging ISS with cell painting. There is a spectral overlap between channels used for cell painting and ISS, and thus ISS becomes non-reliable.
-
Cell painting degrades RNA and destroys barcode. Both teams addressed this by running reverse transcription and RCA (rolling cycle amplification) of DNA before cell painting. ISS imaging is quite destructive (multiple cycles) and happens after cell painting step.
How PERISCOPE solves spectral overlap
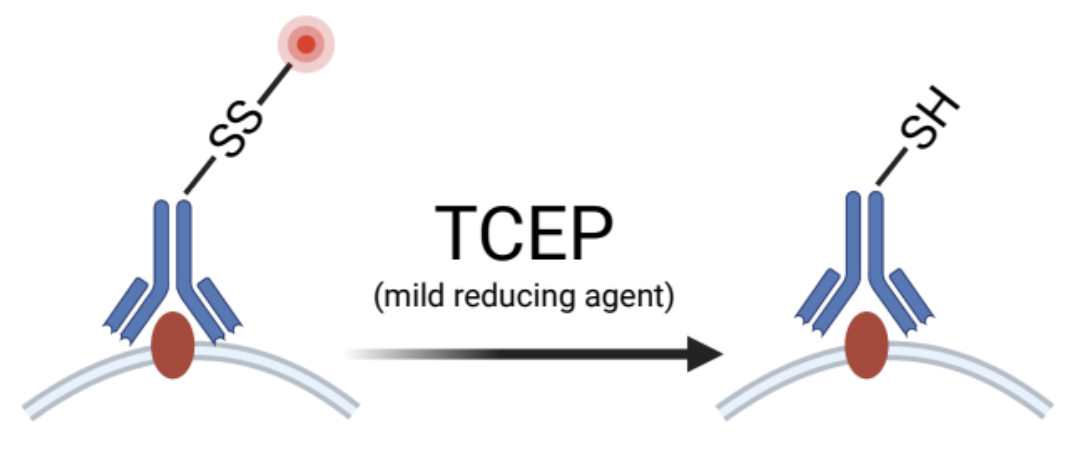 Periscope team replaced two dyes in cell painting with fluorescent labels attached to probes with disulfide linker (see image).
Linker is cleaved right after “phenotypic” (cell painting) imaging, and these two channels could be used for ISS.
Floating fluorescent labels are partially washed and remaining (uniform) signal is cancelled out by image processing pipeline.
Periscope team replaced two dyes in cell painting with fluorescent labels attached to probes with disulfide linker (see image).
Linker is cleaved right after “phenotypic” (cell painting) imaging, and these two channels could be used for ISS.
Floating fluorescent labels are partially washed and remaining (uniform) signal is cancelled out by image processing pipeline.
More specifically, membrane label Concanavalin-A was SS-conjugated to fluorophore directly, while mitochondria stain mitotracker was replaced with anti-TOMM20 Ab + secondary Ab SS-linked to fluorophore. Original cell painting avoided antibodies to make the process cheaper and more reproducible.
As expected, perturbation of TOMM20 distorts the signal from this channel — something to keep in mind.
How CP-POSH solves spectral overlap
Mitotracker was replaced with Mitoprobe — a novel RNA-based label for mitochondria, linked to Cy5 fluorophore. Interestingly, they optimized a sequence to have high correlation with TOMM20 and low correlation with Hoechst (nuclei).
Resulting image (on the right) shows optimization was successful.
RNA sequences were taken from the ribosome after search for fragments that would bind to 12S rRNA and 16S rRNA (two different locations), then tested 8 of them and left two: one for 12s and one for 16s in proportion 1:1. This is an interesting solution and seems to overcome the issues seen in PERISCOPE approach, and likely to work in other species too.
This replacement of mitotracker with mitoprobe does not remove spectral overlap (there is overlap with base A), but makes it non-essential because RNA is degraded during cell-painting. Two additional spectral overlaps (WGA <> base G) and (phalloidin <> base T) are also solved by degrading, and additional steps in the protocol were necessary. These overlaps still seem to play negative role in ISS step (see later).
CP-POSH has an additional channel that can be utilized for one study-specific marker, which is later featured in one of experiments. (They use deep red — good choice, as shorter wavelengths can be used by phenotyping!)
In total both protocols are not straightforward.
In situ sequencing (ISS)
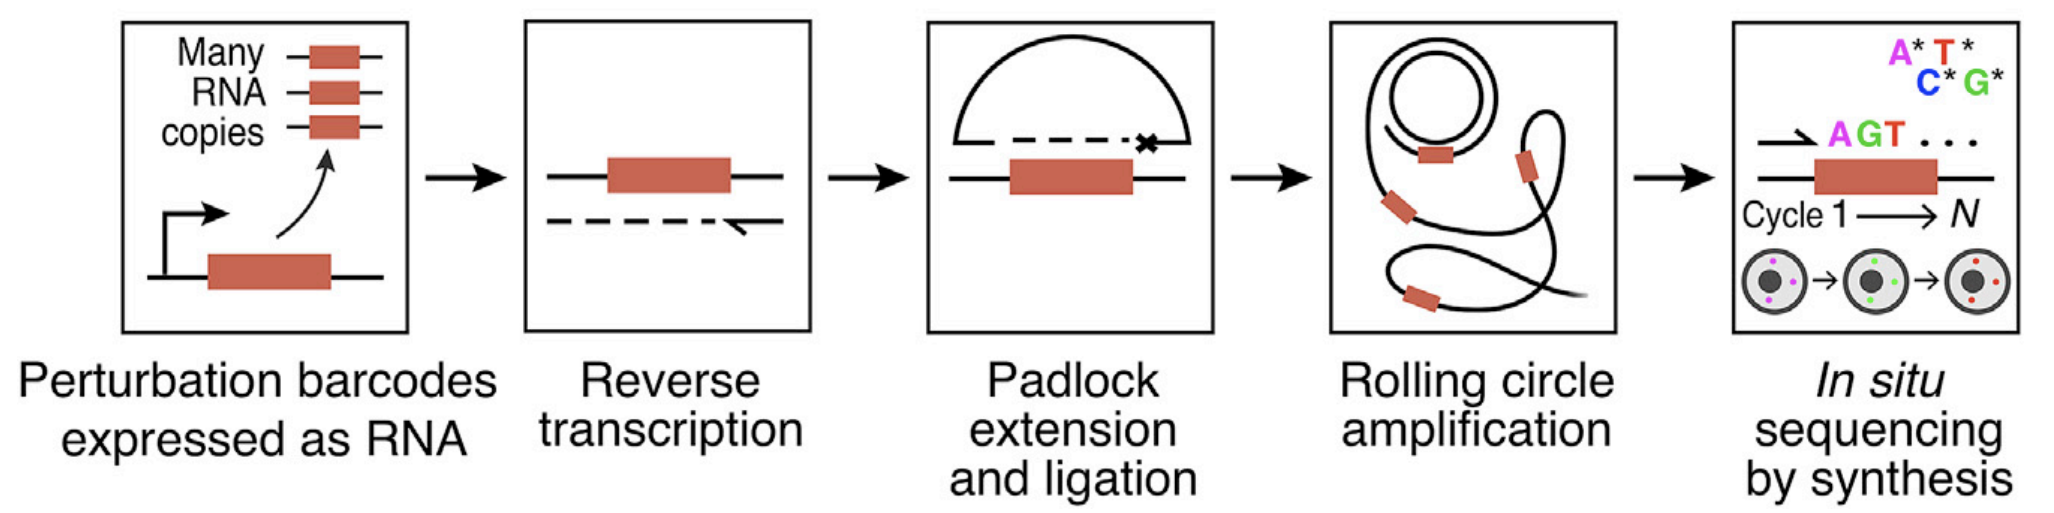 Source: Feldman et al., 2019
ISS reads the barcode to determine perturbed gene. This part is very similar, as both groups:
- use Illumina’s miseq kit for ISS (sequence-by-synthesis), and both groups used lower resolution (10X) for imaging.
- use padlock with gap to amplify barcode to get reliable signal during sequencing
- finally, barcodes used in both cases are not an additional genetic sequences, but sgRNAs themselves.
No barcodes — no problems!
CP-POSH additionally uses tiny image-to-image convnet to improve calling to get +18% correct calls. Such a model can be trained on the screen data itself: almost-correctly called barcodes (with simpler pipeline) are used for training the model.
sgRNAs
Quality of ISS quickly drops with sequence length, so instead of sequencing all ~20 bases of sgRNA, the guides are selected so that reading only first 12-13 bases is enough to guess which sgRNA is expressed in the cell. Groups start from existing pools of sgRNAs to guide Cas9, with minor differences in selection procedure:
- Periscope uses 12 cycles and minimal Levenshtein distance ≥ 2, which means they detect if barcode contains one error (and discard the barcode).
-
CP-POSH uses 13 cycles and Levenshtein distance ≥ 3, and allows up to 1 error correction. Most cells have more than one amplicon, which makes barcode calling even more reliable. Error correction adds +80% of barcoded cells in their largest screen.
I hypothesize high error rate (despite CNN filtering) is connected to spectral overlaps.
Scope of experiments is different: Periscope covers 20k genes with 4 guides per gene, while the largest experiment in CP-POSH targets druggable genome — 1.6k genes with 10 guides per gene.
Phenotypic pipeline and analysis
Both teams avoid training the system on known labels. I’ve also been avoiding training with supervision for a while, for a couple of reasons:
- no need to drop any data from analysis (no labels → no cross-validation)
- by providing labels you already bias model into what you believe is important. Correspondingly model works to ignore all “irrelevant” information, and the same model can’t be used (reliably) for studying orthogonal questions (e.g. well-to-well variations)
- should there be any confounder, it is less likely to be picked
It’s actually impressive how little prior knowledge is required to get a decent grasp of biology just from looking at static cells. We only need to know all genes of the organism to run CRISPR, neural networks don’t need even this piece of information.
PERISCOPE relies on Cell Profiler, and does not train any specific pipeline. After averaging morphological profiles across the cells for the same gene, a matrix of gene similarities is computed.
CP-POSH relies on CellPose for segmentation, and either uses CellProfiler-like pipeline (dubbed CellStats) or self-supervised DINO-ViT from FAIR. Unsurprisingly, DINO-ViT demonstrates better quality, which improves with higher diversity of interventions provided during training. Pre-training on cells not ImageNet works much better, as you’d expect (Insitro-ers for some reason like Imagenet-pretrained models as baseline). DINO-ViT also uses patches 8x8, more relevant to the scale of cell.
A nice detail: they use a well-level compensation. That’s possible thanks to pooling!
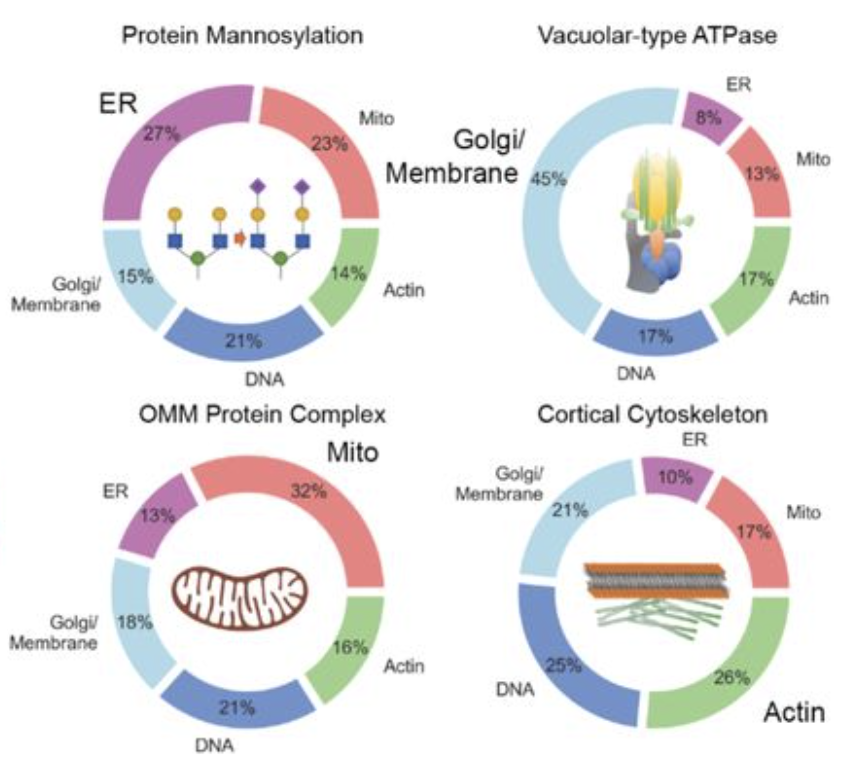 Both papers delve into ‘differential expression’ of hand-crafted morphological features to provide arguments that readout is valid.
For instance, periscope shows that most important features to detect interventions connected to common pathways point to the right cell compartment.
Both papers delve into ‘differential expression’ of hand-crafted morphological features to provide arguments that readout is valid.
For instance, periscope shows that most important features to detect interventions connected to common pathways point to the right cell compartment.
On the picture from PERISCOPE you see that disturbing a pathway results in some enrichment of important features (‘differentially expressed‘ features) from the corresponding cell compartment.
Verification & Discovery
“Method papers” are a special genre of literature: 1) focus of author is technology 2) focus of editor is novel biology 3) authors must provide convincing validation which no one wants to dive in.
This rarely converts into a consistent story for screens, and this time is no exception.
PERISCOPE compares two different medias, running whole-genome screens in each of them — an interesting experiment with unclear interpretation: there are genes that “land in different clusters” depending on the media — but unclear what to do with this information. As I understand, the goal was to demonstrate that running screen in a more physiologically relevant media would yield better insights, but it is unclear if differences (Ext Fig.8) indeed show superiority of either media.
Another interesting shot is the TMEM251 investigation with significant additional research beyond PERISCOPE. If the TMEM251 story really matters, I’d prefer to see it published separately and better verified (using available info from other pooled screens as well), Periscope in this story was needed only for initial guess based on GSEA — but this guess could come from other public screens as well.
Speaking of GSEA… — usage of GSEA in paper (e.g. fig. 6a) makes no sense 😞. GSEA’s power is combining signal from multiple genes with low expression. This problem does not exist in optical screens — as no expression is measured. Preranked GSEA (erroneously) relies on zero correlation between genes, but correlation in optical screens is very high. In fact, this high correlation is a subject of several plots in the paper. To compare pathways, just define another direction in embedding space for each pathway, as you do for single genes. Direction is a (weighted) average of directions for individual genes + measure separation of distributions along direction (e.g. ROC AUC).
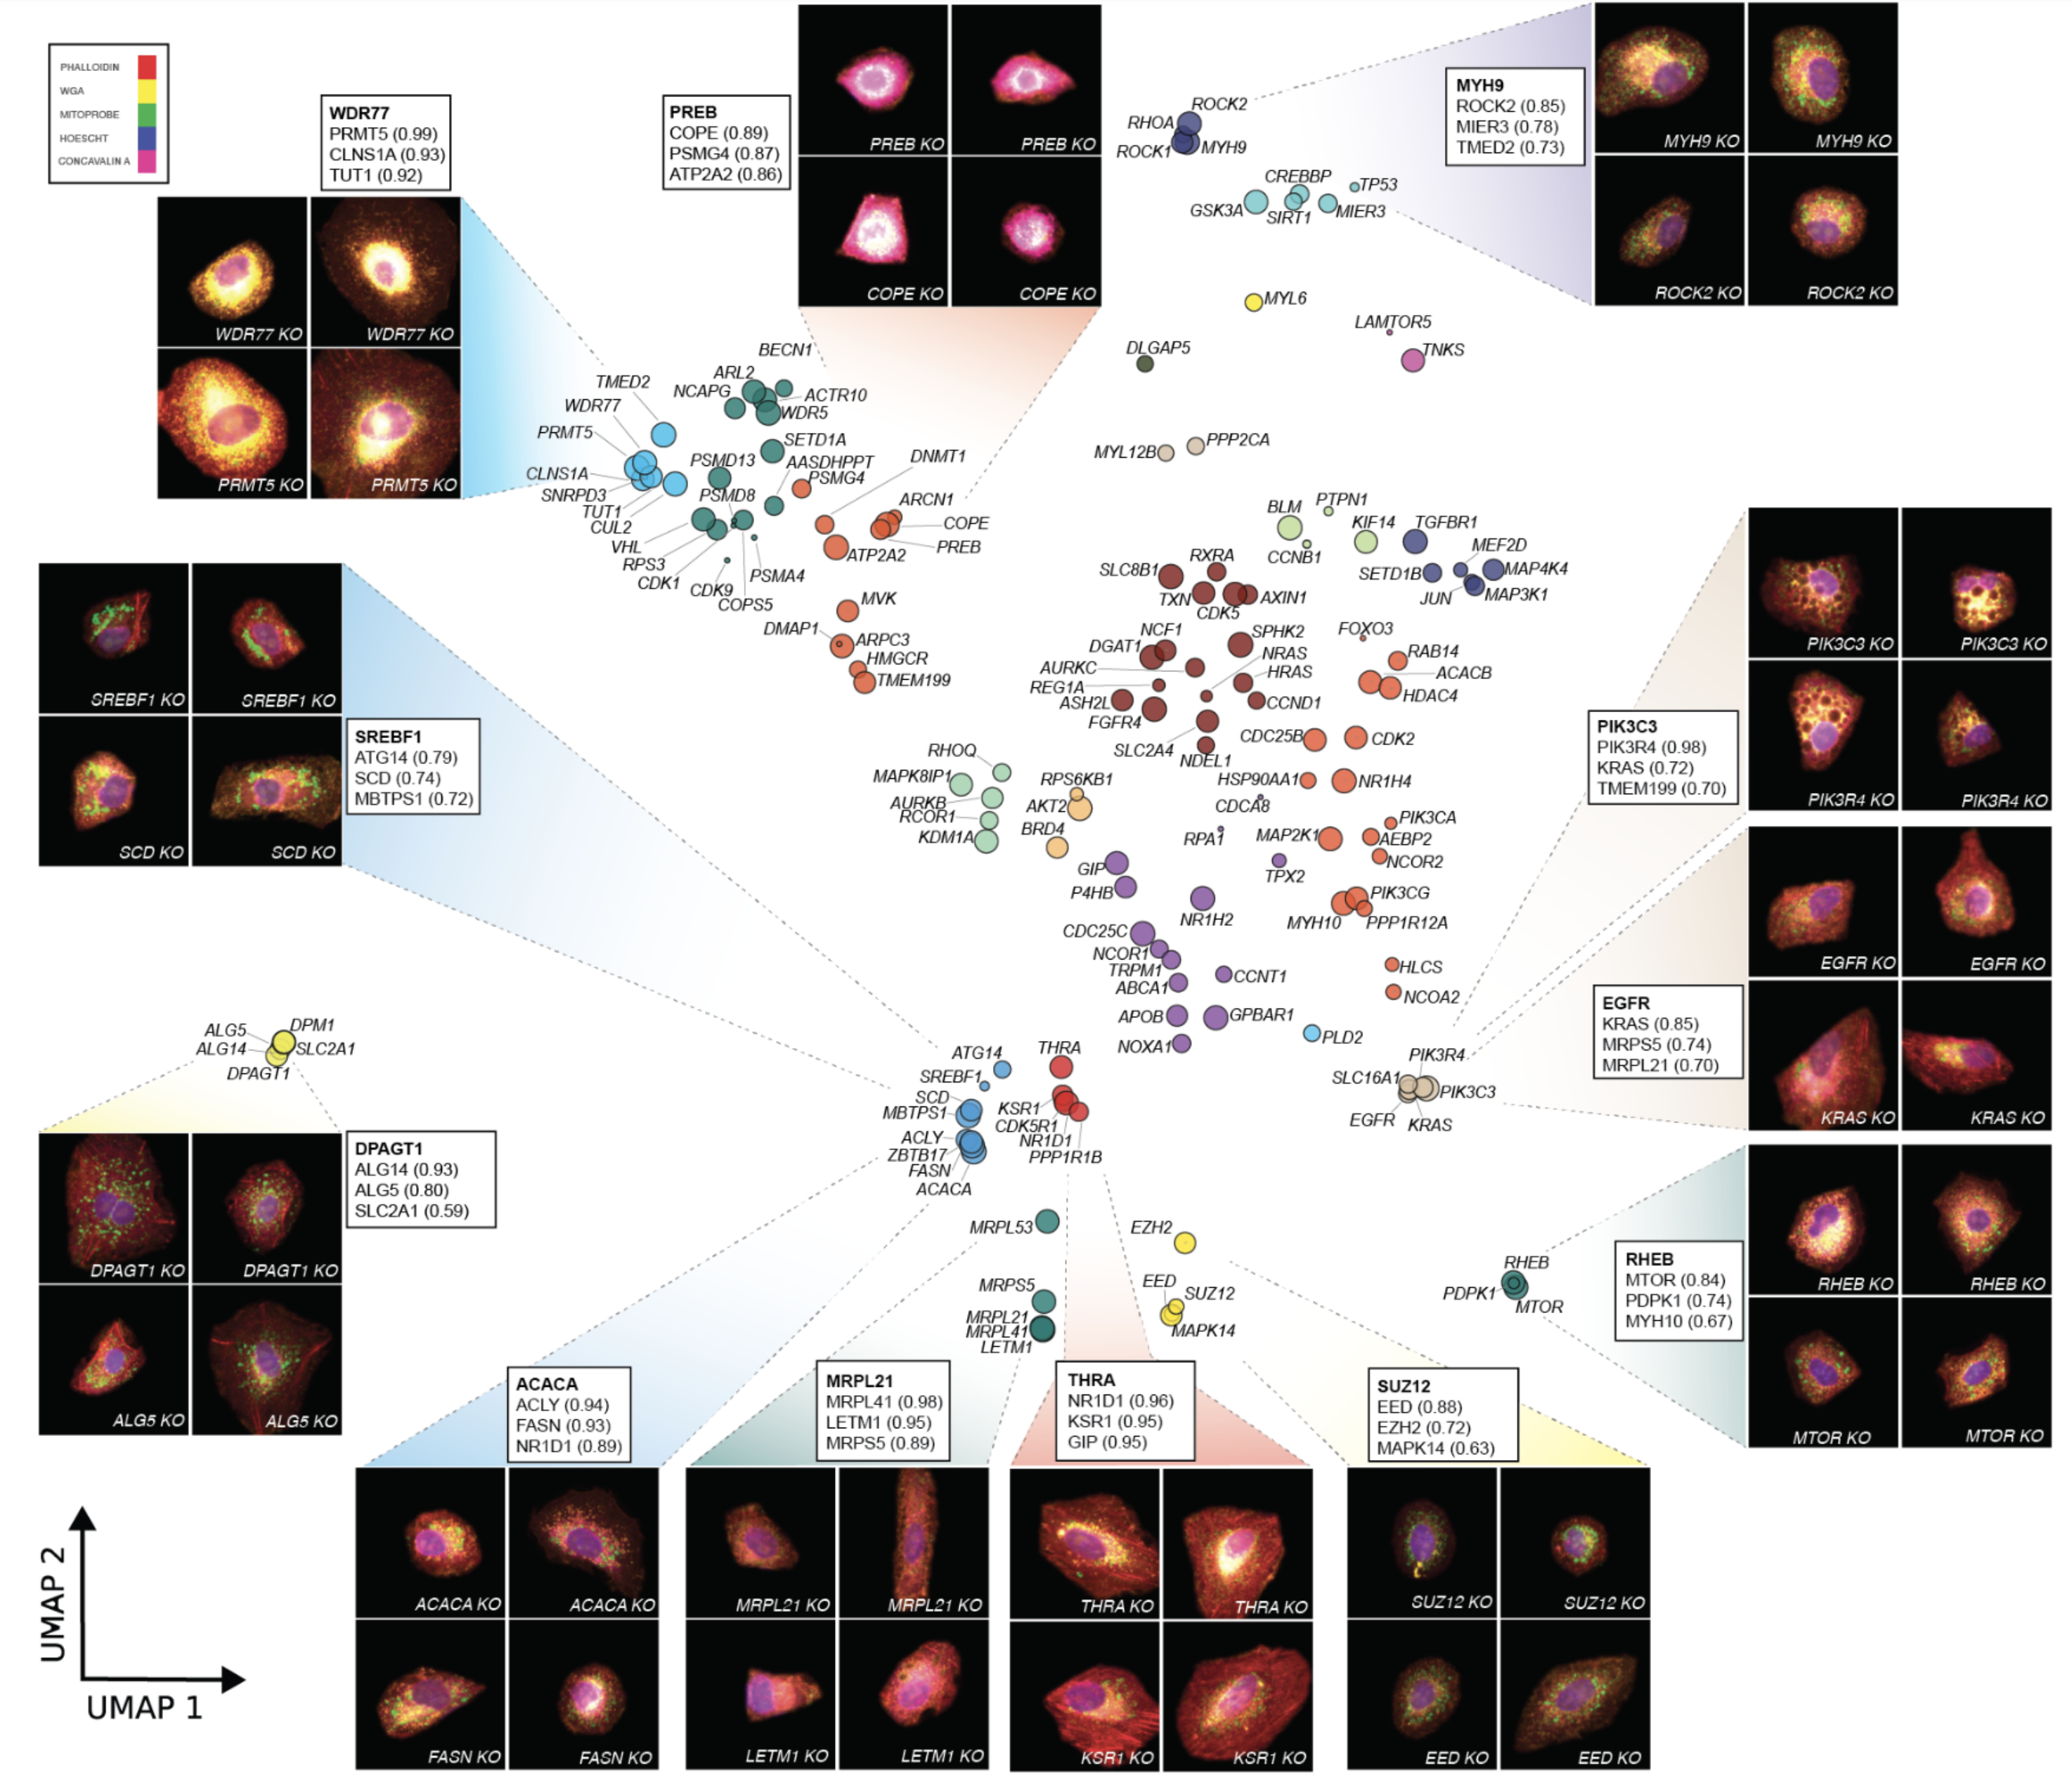 Example UMAP from CP-POSH for one of screens
CP-POSH focuses on druggable genome (1640 genes) with a couple of smaller screens. Each version of pipeline (data + phenotyping model) is compared against StringDB, providing a quantifiable comparison, so they can e.g. demonstrate that targeting more genes is slightly better. They also confirm that trained models generalize to new experiments.
Different versions of screen are presented in a uniform way with UMAP+Leiden clustering applied to genes with a clear morphological signature (see example above).
I was confused by notable divergence between models trained on 300 and 1640 genes, figure 5a. In particular their lists of significant genes (AUC > 0.55) should markedly diverge across models. Also, 0.55 may sound small — however, bear in mind this is a cell-level classification, and combining multiple cells will result in strong discrimination.
Both ViT and CellStats “nominate the potential role of TUT1 in cell cycle regulation”. (No research made to confirm). Interestingly, sgRNA consistency failed for several genes, and half of genes have at least one ‘outlier’ sgRNA (out of 10).
In my opinion, CP-POSH has a consistent storyline and more ‘standardized’ analysis. It looks more like a validation of approach/platform, and less like a bunch of interesting observations (though CP-POSH has these too). PERISCOPE presentation is more aligned to “get published in AAA journal”.
Neither paper discusses cell cycle, a well-known confounder in single-cell studies, how so? 🤷 Optical screens previously characterized full images, not individual cells, and thus did not have to deal with this issue (as there are other cells to get signal from). Since neither team used supervision, pipelines likely cluster dividing cells together, preferring this characteristic over perturbation. Cancelling this in optical screen is an interesting challenge.
So which one to choose?
Great question, fortunately we have papers to help us! So here is my insight: I don’t know. I can’t meaningfully compare performance of two systems after reading preprints. Performance, I guess, is similar — but that’s only a guess. If some lab wants to select which one to go with, this becomes a matter of trust — not how science is supposed to work. (ok-ok, one additional channel can actually make this choice).
Main selling points of optical pooled screens are simple scalability and fewer confounders, which ultimately means hypothesis-free or hypothesis-light research. I doubt that interpretable morphological features are important for practitioners.
Papers lack “power analysis” on how many cells are needed to reconstruct perturbation profile. Very little said about cost ($0.001 per cell — estimate from PERISCOPE, no cost estimates from CP-POSH). These two factors determine if pooled strategy pays out.
Speaking of potential, it is unclear if two sgRNAs per cell can be confidently called with either approach.
Can we do better?
Screen validation should become a benchmark. It’s about time we had a benchmark of reproduction of gene networks/gene ontology with some predefined procedure. Community would benefit from comparing across the screens rather than “rediscovering” mTOR in every screen paper.
Number one question is — can screen discover culture-specific biology? When comparing several cell lines, are gene similarities in optical screen and scRNAseq similar for the same cell line?
It would be of high interest to highlight which pathways are detectable in scRNAseq but hardly noticeable in optical pooled screening (and vice versa). It is of value to know if there are pathways that can be seen in an optical screen or in scrnaseq — and can help in choosing the right instrument for the problem.
Compare screen to screen, not screen to “common knowledge”. Common pathways are a very rough sanity check. Single UMAP with gene grouped by their similarity is descriptive enough. GSEA is a poor argument: it is embarrassingly easy to find something pleasing with GSEA and throw a bunch of impressively small (incorrect) p-values at readers.
Comparison screen-to-screen can detect more subtle biology, specific to the biology of culture, and can actually bring interesting insight.
Discoveries are usually irrelevant for the story and should not be demanded by journals. Method papers are demanded to “show novel biology”, and most of “byproduct discoveries” have no value for readers or authors — otherwise those would be a separate paper.
Faster, cheaper, easier to scale, more reliable, easier to implement are great arguments for technology. If whole smartphone industry can’t deliver “a killer feature” every year, how that can be a requirement for every method? 🤷
Where would this go?
Back to point. Pooled optical screening is an exciting technology, and it has a number of immediate applications. And it is super valuable to understand its current limits.
For instance, I have the following questions on my mind:
- does it transfer? When two labs experiment with same cell line, would they get similar results? In theory, yes, but how about practice?
- similarity and difference with arrayed screens: shared media means studied processed are limited to a single cell, because cell interactions are not restricted to cells with the same perturbation. This has both pros (clearer signal) and cons (if cell interactions/collective behavior are of interest).
- is it suitable to automatically find ‘interesting’ combinations of genes? Can we train RL to discover those for us?
- can it handle tissue slices? Can we pool-screen whole mouse?
- can vision pipeline handle neurons? Is DINO a good choice for that?
Hopefully more research will come and we’ll get answers to these and other questions soon.
Acknowledgments
Thanks to Kevan Shah and Tatiana Dvorkina for proofreading and comments. Thanks to CP-POSH team (Ci Chu, Max Salick) and PERISCOPE team (Meraj Ramezani, Paul C. Blainey) for answering questions.
Comments
Paul C. Blainey provided some pointers to prior works of his lab, relevant to the questions I discuss in the post:
… a couple of comments that you may find interesting:
- In Figure S2 of Feldman et al., 2019 we showed efficient detection of 2 guides per cell (in ~80% of cells)
- In Carlson et al, 2023 we use a different and simple strategy to overlap IHC and SBS in the same channels which is to titrate down the IHC reagents
- Both of these works demonstrate a potentially standardizable validation approach to do a follow-up (“secondary”) screen in an independent experiment with higher replication (more cells and/or guides per gene). The hit ranks or feature scores can be compared gene-wise or guide-wise across the primary and secondary to check reproducibility of the results. This can be for technical validation (same assay and guides) or biological validation (new assay and/or new biological model system).
So far we’re seeing impressive reproducibility which supports some of the more challenging and informative use cases you suggest.- Funk et al, 2022 demostrated that cell cycle can be treated more explicitly, we added 24-hour live imaging of cells prior to fixation
 Gradient boosting
  Hamiltonian MC
  Gradient boosting
  Reconstructing pictures
 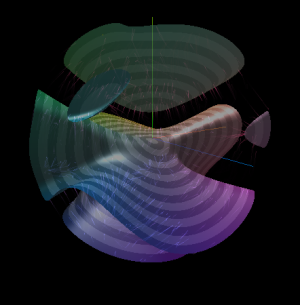 Neural Networks